BPSC Exam Prep

Bihar Economic Survey 2023-24

Table of Contents

On 12 February 2024, Bihar’s Deputy Chief Minister Samrat Choudhary, who is also the Finance Minister tabled the 18th Bihar Economic Survey. The presentation took place on the first day of the Bihar Legislative Assembly’s budget session after the address of Governor Rajendra Vishwanath Arlekar
 
(Note: Bihar’s first Economic Survey was presented in 2006-07 by then deputy Chief Minister & Finance Minister of Bihar Sushil Modi.)

An overview on Bihar's Economy:

Gross State Domestic Product (GSDP):

(at Constant Prices)
  • In 2022-23 the Gross State Domestic Product (GSDP) of Bihar, at Constant prices, is estimated to be ₹4,42,473  crore according to its Quick Estimates (Q.E), as against ₹3,99,930 crore according to its Provisional Estimates (P.E) in 2021-22.
  • This implies the real GSDP of Bihar grew at 10.64 percent in 2022-23. This growth rate was the highest among all the States and UTs in the country, followed by Assam (10.2 percent) and Delhi (9.2 percent).
  • The GSDP at constant prices has increased at the average annual rate of 5.4 percent in the state since 2011-12.

Size of Bihar economy and growth rate

  • The real GSDP of the State shows a dip in 2020-21, which was due to the COVID-19 restrictions. Later the economic activities expanded rapidly and the real GSDP has exceeded the pre-COVID levels as projected by the quick estimates in 2022-23.

• In 2022-23, the Global growth rate was 3.1 percent, while the Indian economy grew at a rate of 7.2 percent.

• The growth rate of Bihar was 7.5 percentage points higher than the global growth rate, while 3.4 percentage points higher compared with the Indian economy.
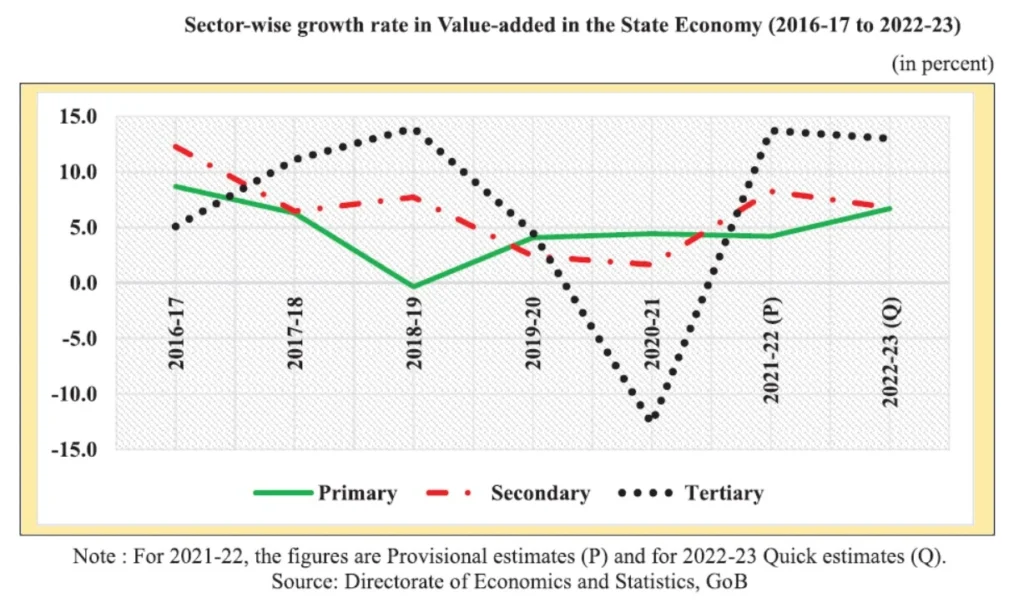
(at Current prices)
  • In 2022-23 the GSDP, of Bihar at Current prices is estimated to be ₹7,51,396 crore (Q.E), as against ₹6,50,302 crore  (P.E) in 2021-22, implying a growth of 15.5 percent.
  • The GSDP at current prices has increased at the average annual rate of 10.6 percent in the state since 2011-12
Per Capita GSDP:

(at Constant prices):

  • In 2022-23, at Constant prices, the per capita GSDP (i.e. the real per capita income) in Bihar stood at ₹35,119 and it was 9 per cent higher than the previous year (2021-22).

(at Current prices):

  •  In 2022-23, at Current prices, the per capita GSDP (i.e. the nominal per capita income) in Bihar stood at ₹59,637 with an increase of  13.9 percent over the previous year. 

• In 2022-23, India’s real and nominal per capita income is estimated to be ₹98,374 and ₹1,72,276 and, respectively.

• The average annual percentage growth in real per capita income of Bihar was 2.3 percent during the previous five years, which is higher than the growth rate of 1.7 percent of India. 

Net State Domestic Product (NSDP)

(at Constant prices)
  • In 2022-23, the real Net State Domestic Product (NSDP) of Bihar is estimated to be ₹3,94,114  crore.
  • The NSDP at constant prices has increased at the average annual rate of 5.1 percent in the state since 2011-12.
(at Current prices)
  • In 2022-23, the nominal Net State Domestic Product (NSDP) of Bihar is estimated to be ₹6,81,761  crore.
  • The NSDP at current prices has increased at the average annual rate of 10.4 percent in the state since 2011-12.
Per Capita NSDP:

(at Constant prices):

• The per capita NSDP at constant prices of Bihar stood at ₹31,280 in 2022-23.

• This has increased at an average annual rate of 3.4 percent between 2011-12 and 2022-23. 

• The percentage growth is estimated to be 9.1 percent in 2022-23.

• The per capita NSDP of Bihar was 31.8 percent of the national average (₹ 98,374).

(Note: The Per Capita Income of a State is measured as the Per Capita NSDP) 


(at Current prices):
• The estimated NSDP at Current prices in 2022-23 is ₹ 6,81,761 crore, implying a per capita NSDP of ₹54,110.

Structural Composition of Bihar Economy

Among the three major sectors (Primary, Secondary, and Tertiary), the share of each sector in the overall Gross State Value Added (GSVA) in the year 2022-2023 are as follows:

Primary sector:

The share of the primary sector has declined from 22.14 percent in 2016-17 to 19.97 percent in 2022-23.

In the primary sector, Crops and Livestock are significant contributors, with shares of 9.9% and 6.6% respectively in 2022-23. However, the share of Crops has been decreasing at an average annual rate of 4.0% since 2016-17, while the share of Livestock has increased at an average annual rate of 2.3% over the same period. This could indicate a diversification within the primary sector, with a growing emphasis on livestock.

Secondary Sector:

The share of the secondary sector has also recorded a marginal decline from 20.60 percent in 2016-17 to 20.04 percent in 2022-23.

The secondary sector is dominated by Manufacturing and Construction, each contributing 8.7% and 9.4% respectively to the GSVA in 2022-23. Their shares have remained relatively stable from 2016-17 to 2022-23.

Tertiary Sector:

The tertiary sector has seen growth, with its overall share increasing from 57.26 percent in 2016-17 to 59.98 percent in 2022-23. 

The tertiary sector has contributed significantly to the growth of the state’s economy in the last four years, from 2019-20 to 2022-23.Within this sector, Trade & Repair Services and Transport, Storage, Communication & Services related to Broadcasting (TSC&S) are significant, contributing 15.8% and 10.7% respectively in 2022-23. Notably, the share of road transport within TSC&S has increased from 5.01% in 2016-17 to 5.87% in 2022-23. Real Estate, Ownership of Dwelling & Professional Services (REID&PS) also contributed 9.4% to the GSVA in 2022-23.

Sector-wise growth rate in Value-added in Bihar's economy

Sector wise growth rate in Value added in Bihar's economy

Primary Sector:

  • Over the recent years, the primary sector has shown relatively stable growth in the economic activities.
  • During the COVID-19 pandemic, the value added by the activities in the primary sector expanded by 4.4 percent.
  • The value-added by the primary sector is estimated to increase by 6.7 percent in 2022-23.

Secondary Sector:

  • In recent years, the secondary sector has shown small growth in the economic activities.
  • The secondary sector expanded by 1.6 percent in 2020-21. 
  • This is estimated to increase at a relatively higher rate of 8.3 percent in 2021-22. 
  • The value added by the secondary sector is estimated to increase by 6.8 percent in 2022-23.

Tertiary Sector:

  • In the recent years, the year-on-year growth in tertiary sector has been more volatile than the primary and secondary sectors.
  • In 2020, this sector has seen a sharp decline due to the COVID-19 pandemic. However, it has shown a V-shaped recovery later.
  • The tertiary sector expanded by 13.7 percent in 2021-22 after a contraction of 12.7 percent in 2020-21.
  • The value added by the tertiary sector is estimated to increase by a substantial 13.0 percent in 2022-23.

Comparison of sector-wise share in GSVA/GVA and Employment for Bihar and India:

Primary Sector:

  • This sector has the most significant employment share but the lowest shares in terms of value added for both Bihar and India.
  • Agriculture remains the biggest employer within this sector.
  • The share of the primary sector in GSVA was 20.7 percent in Bihar and 17.8 percent in India in 2021-22.
  • The sector absorbed 47.8 percent of the total workforce in Bihar and 45.8 percent in India in 2021-22.
  • The share of the primary sector in employment increased by 2.6 percentage points in Bihar and 1.2 percentage points in India between 2017-18 and 2021-22.

Secondary Sector:

  • This sector had a 20.7 percent share in GSVA in Bihar and a 29.2 percent share in India in 2021-22.
  • The sector’s share in employment was 25.9 percent in Bihar and 24.6 percent in India.
  • Within this sector, Construction had the highest share of employment in both Bihar (18.6%) and India (12.4%) in 2021-22.
  • The manufacturing sector had a 9.5 percent share in GSVA in Bihar and an 18.4 percent share in India in 2021-22. However, the share of manufacturing in employment was lower, at 6.8 percent in Bihar and 11.6 percent in India.

Tertiary Sector:

  • This sector had a 58.6 percent share in GSVA in Bihar and a 53.0 percent share in India in 2021-22.
  • However, the share of the sector in employment was lower, at 26.3 percent in Bihar and 29.7 percent in India.

In summary, the primary sector employs the most people but contributes the least to the GSVA, while the tertiary sector contributes the most to the GSVA but employs fewer people. The secondary sector falls in between. These trends are similar for both Bihar and India as a whole.

Gross Fixed Capital Formation (GFCF):

In the dynamic world of economics, where growth and development are paramount, the concept of GFCF plays a pivotal role. Imagine a state where investments are not merely consumed but channeled into productive assets—this is precisely what GFCF represents. In economic terms, GFCF represents the investment in fixed assets rather than consumption. It is calculated as the total value of a producer’s acquisitions minus disposals of fixed assets during an accounting period, along with certain additions to the value of non-produced assets realized through productive activity. Estimates of GFCF are compiled only for the Government sector and departmental commercial undertaking.

Gross Fixed Capital Formation (GFCF) as percentage of GSDP in Bihar

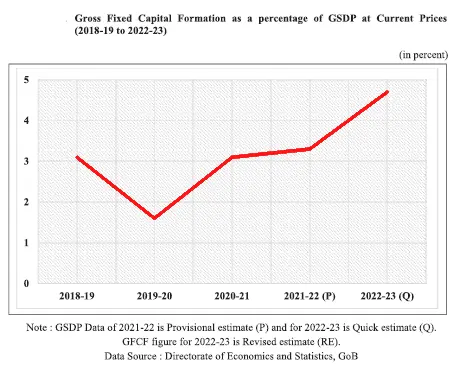
The GFCF at current prices in Bihar has increased from ₹16,429 crore in 2018-19 to ₹35,343 crore in 2022-23.

The GFCF as a percentage of GSDP at current prices has consistently risen from 1.6 percent in 2019-20 to 4.7 percent in 2022-23.

Regional Disparity:

Bihar’s economy is also characterized by considerable regional (inter-district) disparity. This implies that the benefits of the growth process are yet to reach evenly across its 38 districts.
 
One of the key indicators of this phenomenon is the Per Capita GDDP of various districts. The estimates of Per Capita Gross District Domestic Product (GDDP) is prepared by the Directorate of Economics and Statistics (DES).
 
Based on Per Capita GDDP the three most prosperous and least developed districts in Bihar are as follows:
 

Most Prosperous:

1. Patna (Highest Per Capita GDDP of ₹1,14,541)
2. Begusarai (₹46,991)
3. Munger (44,176)
 

Least developed:

1. Sheohar (₹18,980)
2. Araria (₹19,795)
3. Sitamarhi (₹21,448)

• The per capita GDDP of Patna is nearly six times the Per Capita GDDP of Sheohar.

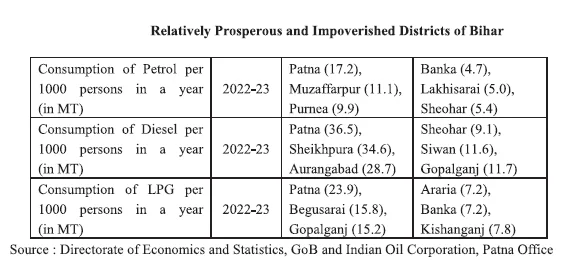
• The per capita income in the six districts of Bihar, viz., Patna, Begusarai, Munger, Bhagalpur Muzaffarpur, and Rohtas, was higher than the state average (₹32,212) in 2021-22.

The economic disparity across the districts may also be considered through the Consumption of Petroleum Products (Petrol, Diesel, and LPG). Based on this, the relatively prosperous and impoverished districts of Bihar are as follows:

Relatively prosperous and impoverished districts of Bihar

Inflation:

The percentage increase in the prices of commodities and services over a period of time is termed as inflation rate.

The annual Inflation Rate for the Consumer Price Index (CPI) base 2012, for the second half of the year 2022-23 is as follows:

Rural: 5.5%

Urban: 5.6%

Combined (Rural & Urban): 5.5%

The inflation rate in Bihar was 5.5 percent between September 2022 and September 2023.

The inflation rate in Bihar exceeded the all-India level, which stood at 5 percent.

Moreover, the rural rate of inflation in Bihar was also higher than the all-India level, which stood at 5.3 percent. It may be noted here that since, in Bihar, close to 90 percent of the population lives in rural areas, it’s the CPI for rural areas that’s more relevant for the people of Bihar.

To a relief, the price rise in Bihar has remained lower than many other major states like Haryana, Rajasthan, and Karnataka during this period.

Few Definitions:

■ Gross State Domestic Product (GSDP): GSDP is defined as a measure, in monetary terms, of the volume of all final goods and services produced within the boundaries of the State during a given period of time.


■ Gross State Value Added (GSVA): The value of output minus the cost of inputs is the value added by a production unit. GSVA is the sum of value added for all final goods and services. 

GSDP is GSVA plus subsidies, minus taxes.


Provisional Estimate (PE)The Provisional Estimate is the first full-year (i.e whole financial year) estimate which is based on 12 months of data on all sectoral indicators.

Quick Estimate (QE): Quick Estimate which is also called as First Revised Estimate is based on the detailed information budget of the Government, financial statements of public and private corporations, 42 crops, horticulture, animal husbandry and forestry.


■ Per Capita Income (PCI)PCI or average income measures the average income earned per person in a given area in a specified year. It’s calculated by dividing the area’s total income by its total population.


■ Constant prices are a way of measuring economic change considering a year as base year as in this case, it is 2011-12. It gives the real Gross State Domestic Product (GSDP) growth.

Constant prices adjust for the effects of inflation, while computing GSDP. Use of constant prices enables measurement of the actual change in output, correcting for the effects of inflation.


■ Current prices are a way of measuring economic change considering price prevailing in the same year. It gives the nominal Gross State Domestic Product (GSDP) growth.


■ Factor cost: It is the total cost of all the factors of production (Land, Labour, Capital and Entrepreneur) consumed or used in producing a good or service.


■ Basic Price: It’s the amount receivable by the producer from the purchaser for a unit of a good or service produced as output minus any tax payable, and plus any subsidy receivable, by the producer as a consequence of its production or sale. It excludes any transport charges invoiced separately by the producer.

Basic prices exclude any taxes on products the producer receives from the purchaser and passes on to government but include any subsidies the producer receives from government and uses to lower the prices charged to purchasers.


Factor Cost

+ Production taxes

– Production subsidy

Basic prices

+ Taxes on products excluding invoiced VAT

– Subsidies on products

Producers’ prices

+ VAT not deductible by the purchaser

+Separately invoiced transport charges

+Wholesalers’ and retailers’ margins

=Purchasers’ prices (or the price at which that product is being sold in the Market)  

 • N.B.: Production taxes and subsidies are different from product taxes and subsidies.


■ Production taxes or subsidies: These are paid or received with relation to production and are independent of the volume of actual production.

Examples of production taxes: Stamp duty, Registration Fee, Land Revenues etc.

Examples of production subsidies: Interest subsidies, Farm subsidies etc.

■ Product taxes or subsidies: These are paid or received on per unit product hence it is dependent on volume of production.

Examples of Product taxes: Indirect taxes like Sales Tax, GST etc


■ Consumer Price Index (CPI):

It is designed to measure the changes over time in general level of retail prices of selected goods and services (basket of commodities) that households purchase for the purpose of consumption.

CPI measures price changes by comparing, through time, the cost of a fixed basket of commodities. The basket is based on the expenditures of a target population in a certain reference period. Since the basket contains commodities of unchanging or equivalent quantity and quality, the index reflects only pure price.

 Uses:

  • as a macroeconomic indicator of inflation.
  • as a tool by Government and Central Bank for targeting inflation and monitoring price stability.
  • as deflators in the National Accounts.

Given the many uses of CPIs, it is unlikely that one index can perform equally satisfactory in all applications. Therefore, there is a practice of compiling several CPI variants for specific purpose. These are:

  • CPI for Industrial Workers (IW) – Base Year 2016;
  • CPI for Agricultural Labourers (AL) Base Year 1986-87
  • CPI for Rural Labourers (RL)– Base Year 1986-87;
  • CPI (Rural/Urban/combined) – Base Year 2012.

N.B.:

The first three are compiled and released by the Labour Bureau in the Ministry of Labour, while the fourth one is released by the National Statistical Office (NSO) in the MoSPI.

The all-India linked CPI for Urban Non-Manual Employees (UNME) has been discontinued w.e.f Jan 2011.

■ Wholesale Price Index (WPI):

It’s a measure to monitor the dynamic movement of prices at the wholesale level.

It comprises all possible transactions at first point of bulk sale in the domestic market.

WPI tracks prices at the factory gate level, but it’s only for Goods and does not include Services.

It is compiled and released on monthly basis by the Office of Economic Adviser, Department of Promotion of Industry and Internal Trade (DPIIT), Ministry of Commerce & Industry.

The base year of All-India WPI is 2011-12 and it uses 697 items in the basket.

Uses:

  • Track the supply and demand dynamics in industry, manufacturing and construction.
  • Used as a deflator of various nominal macroeconomic variables including GDP.
  • Serve as an important determinant, in formulation of trade, fiscal and other economic policies by the Government.
  • Also used for the purpose of indexation/escalation clauses in the supply of raw materials, machinery and construction work.


 Components of WPI:

  • Primary articles (Weight 22.62%).
  • Fuel & Power (Weight 13.15%)
  • Manufactured Goods (Weight 64.23%)
  • WPI Food Index (Weight 24.38%)

References:

  • Bihar Economic Survey (2023-24) and previous years
  • Directorate of Economics and Statistics, Government of Bihar
  • Ministry of Statistics and Programme Implementation, Government of India

***

Follow Us:

BPSC Exam Prep

Don't miss out on crucial Exam Updates and Vital Notifications from BPSC Exam Prep!

We don’t spam! Read our privacy policy for more info.

Read More:

Scroll to Top