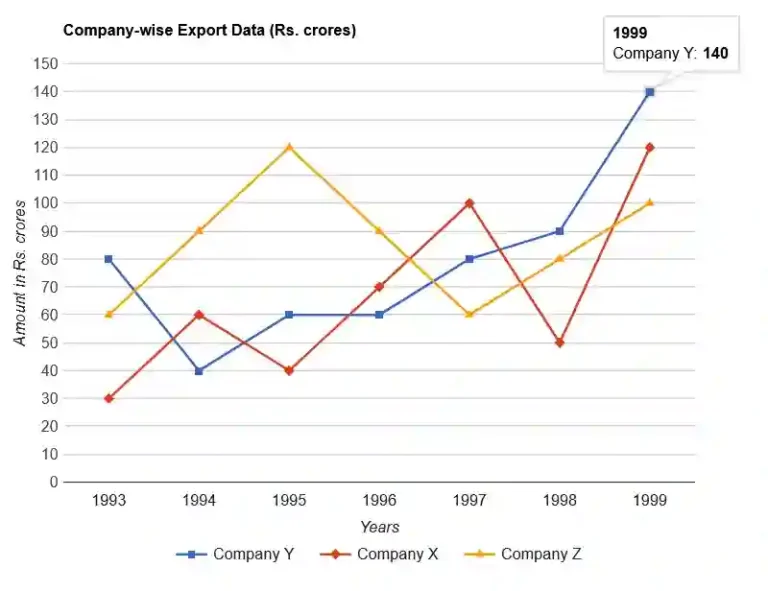
The graph shows the exports from three companies X, Y, and Z, during the year 1993 to 1999 Read More »
The following table demonstrates the number of candidates appeared, qualified and selected from five States over 1994 to 2000 Read More »
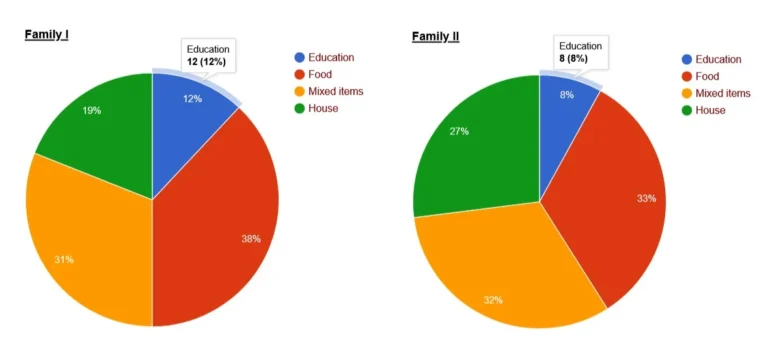
The pie diagrams given below represent the expenditure of two families I and II on different items in percentages Read More »
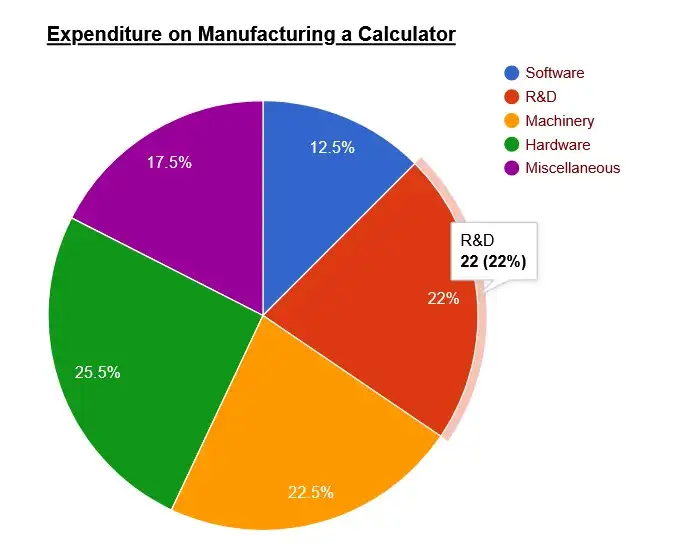
The following pie-chart shows the expenditure incurred on the manufacturing of a calculator under various heads. Read More »