Sorry, but you do not have permission to view this content.
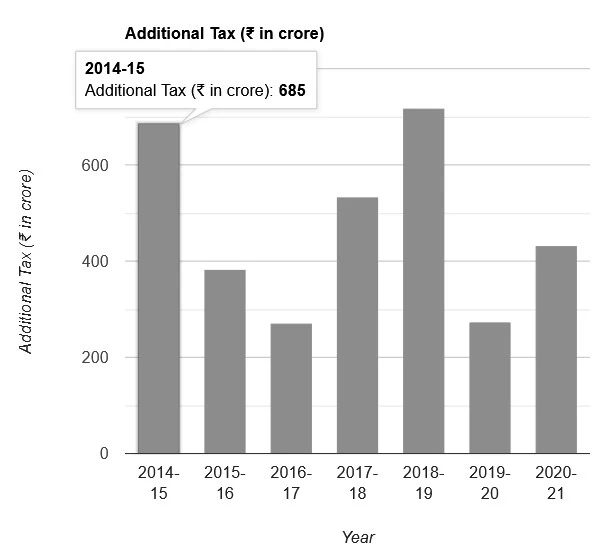
The bar graph represents the additional tax collected by a State in different years
This is a subscription-based article. Subscribe now to gain access!
Syllabus: GS-1| Statistical analysis, graphs and diagrams| Bar Graph
Marks: 36
Asked in: BPSC- (69) 2023
Articles:

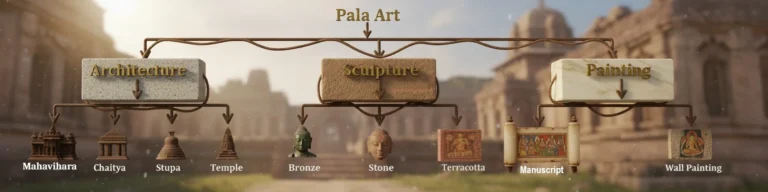
- Chief features of Pal Art | GS1- Modern History of India and Indian culture
- BPSC: (65)2019; (47)2007; (43)2001; (41)1997
Other Posts:

- GS-2 | Section III | Science & Technology | 36*2 = 72 Marks
- BPSC: (70)2025| (69)2023 | (68)2023 | (67)2022 | (66)2021 | (65)2020 | (64)2019 | (63)2019 | (60-62)2018
- Syllabus: Science and Technology
- GS-2 | Section II | Indian Economy and Geography of India | 38*3 = 114 Marks
- BPSC: (70)2025| (69)2023 | (68)2023 | (67)2022 | (66)2021 | (65)2020 | (64)2019 | (63)2019 | (60-62)2018
- Syllabus: Geography of India, Indian Economy

- GS-2 | Section I | Indian Polity | 38*3 = 114 Marks
- BPSC: (70)2025| (69)2023 | (68)2023 | (67)2022 | (66)2021 | (65)2020 | (64)2019 | (63)2019 | (60-62)2018
- Syllabus: Indian Polity

- GS-1| Section III| Statistical analysis, graphs and diagrams | 36*2=72 Marks
- BPSC: (70)2025| (69)2023 |
- GS-1| Section I| Modern History of India & Indian Culture | 38*3 = 114 Marks
- BPSC: (70)2025| (69)2023 | (68)2023 | (67)2022 | (66)2021 | (65)2020 | (64)2019 | (63)2019 | (60-62)2018