Question Bank: Statistical analysis, graphs and diagrams
With Complete Solutions
Filter by Year & Topic.
The following table demonstrates the number of candidates appeared, qualified and selected in a competitive examination from five States Delhi, Himachal Pradesh, Uttar Pradesh, Punjab and Haryana over the years 1994 to 2000. Study the table carefully and answer the questions given below it:
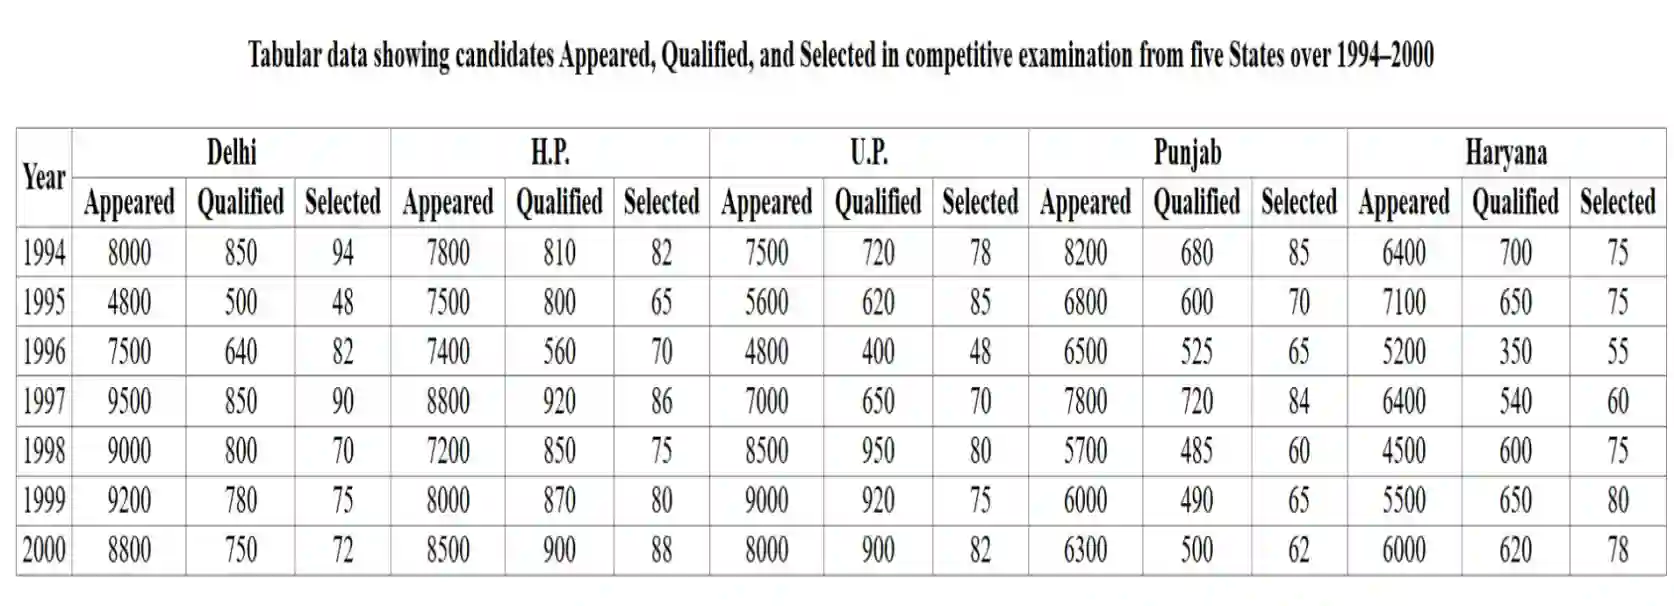
Questions:
- (a) For which State the average number of candidates selected over the years is maximum? (6 marks)
- (b) For which year the percentage of candidates qualified from Haryana over the candidates appeared from Haryana is highest? (6 marks)
- (c) In the year 1999, which State had the lowest percentage of candidates selected over the candidates appeared from that State? (6 marks)
- (d) For which State the ratio of candidates selected and the candidates qualified is highest for the year 1997? (6 marks)
- (e) Which State has the highest percentage of total candidates selected over the total candidates appeared from that State during the years under consideration? (6 marks)
- (f) Find the ratio of the total candidates selected, qualified and appeared from U.P. during the year 1994 to 2000. (6 marks)
OR Question:
The bar diagram given below shows the production (in tons) of three crops — paddy, wheat and maize during the year 2002 to 2005 in a country. Study the diagram carefully and answer the questions given below it:

Questions:
- (a) What is the ratio of total production of paddy, wheat and maize in the country during the year 2002 to 2005? (6 marks)
- (b) The total production of maize is what percentage of the total production of the three crops during the years under consideration? (6 marks)
- (c) The average production of wheat is what percentage of the average production of paddy during the years under consideration? (8 marks)
- (d) What percentage of the production of maize should be increased or decreased, so that the total production of maize is exactly half of the total production of paddy in the country during 2002–2005? (8 marks)
- (e) If in the year 2004, the production of wheat is increased by 50% and the production of paddy is decreased by 40%, then the production of paddy will be what percentage of the production of wheat? (8 marks)
The following pie-charts represent the expenditure (in rupees) of two families, A and B. Study the charts carefully and answer the questions given below them:

Questions:
- (a) What is the total expenditure of the two families (in rupees) on food? (6 marks)
- (b) The total expenditure of the two families on fuel is what percent of the total expenditure of the two families on clothing? (6 marks)
- (c) If the expenditure of the two families on food and house rent is increased by 20% and 30% respectively, then what will be the percentage increase in the total expenditure of the two families combined? (8 marks)
- (d) The expenditure on clothing for the two families is increased by 15%. What percentage of expenditure on miscellaneous should be decreased by the two families separately, so that their total expenditure remains the same? (8 marks)
- (e) If the expenditure of the two families on food, clothing and house rent is increased by 10%, 20% and 30% respectively, then find the ratio of their total expenditures on food, clothing and house rent. (8 marks)
OR Question:
The following graph shows the exports from three companies X, Y, and Z (in Rs. crores) during the year 1993 to 1999. Study the graph carefully and answer the questions given below it:
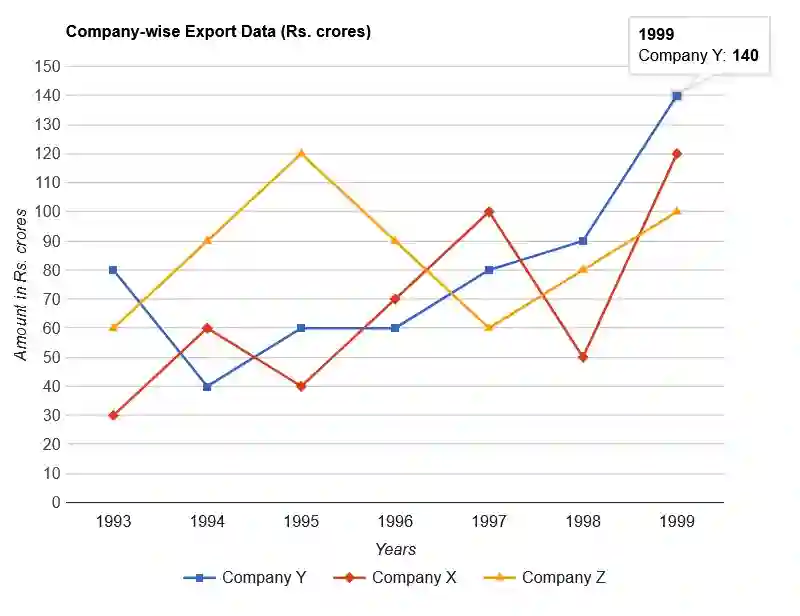
Questions:
- (a) Which company had the steepest rise in its exports compared to the previous year and in which year? (6 marks)
- (b) Which company had the highest percentage increase in its exports in the year 1999 as compared to the year 1993 and what was this percent? (6 marks)
- (c) If in the year 2000, the exports of the three companies X, Y and Z are increased by 10%, 20% and 30% respectively as compared to their exports in the previous year, then what will be the ratio of their exports in the year 2000? (8 marks)
- (d) What percentage of export should be increased by the companies X and Y in the year 1996, so that their export becomes double of the export done by company Z in the year 1996? (8 marks)
- (e) If in 1992, the export by the company Z was 30% less than that in 1993 and the export by the company X was 30% more than that in 1993, then what was the difference (in Rs. crores) between the exports by the companies Z and X in the year 1992? (8 marks)
Study the following table carefully and answer the questions given below this table:
There are three companies X, Y, and Z making identical soaps in the form of bars.
Soaps are sold by the number of units.
Total sales = Selling price × Units sold.
Assume: Only these three companies exist in the market.
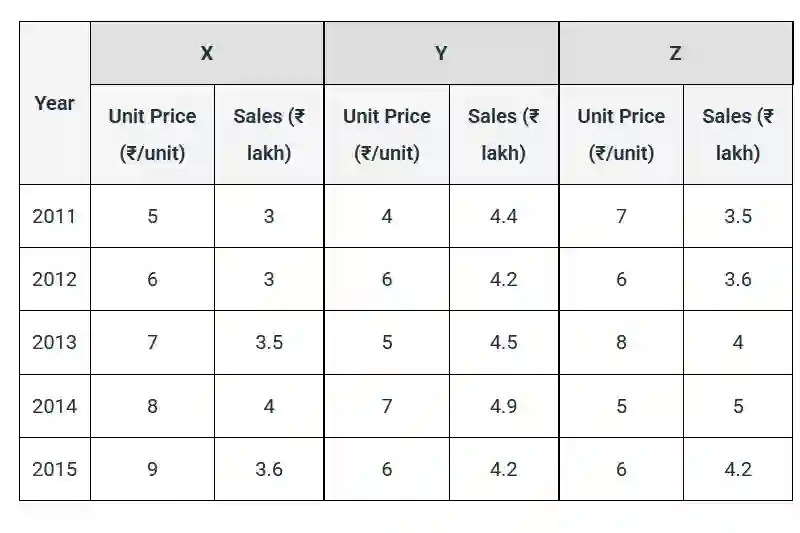
Questions:
- (a) What was the average price of soap in the year 2013 (₹/unit)? (8 marks)
- (b) What was the percentage decrease in units sold for X in 2012 over 2011? (8 marks)
- (c) What was the percentage share of Z in the total units sold in 2013? (8 marks)
- (d) In which year Y sold the maximum number of units? (6 marks)
- (e) The maximum price per unit given in the table exceeds the minimum price per unit by what percentage? (6 marks)
OR Question:
The following pie-chart shows the expenditure incurred on the manufacturing of a calculator under various heads. Study the pie-chart carefully and answer the questions given below:
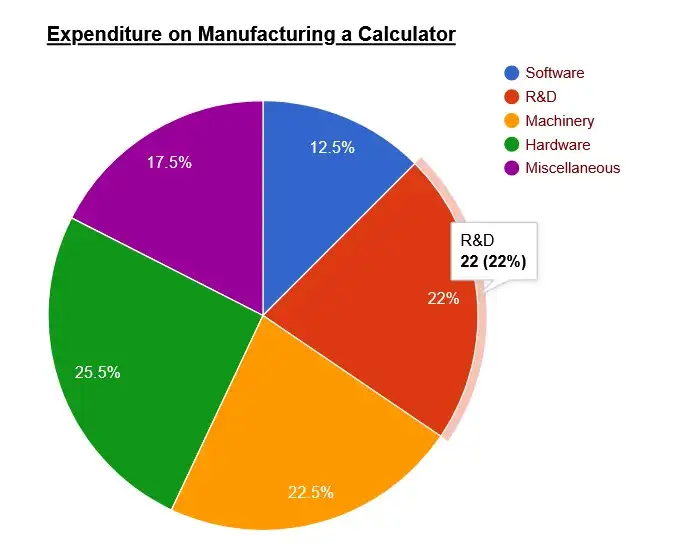
Questions:
- (a) What is the central angle of the sector showing the expenditure incurred on paying for the software? (6 marks)
- (b) What is the cost price of the calculator on which the cost of R&D and machinery charges amount to ₹127.50? (6 marks)
- (c) The marked price of a calculator is 24% more than its cost price. If the marked price of a calculator is ₹186, then what is the cost price of R&D used in a single unit of calculator? (8 marks)
- (d) If the machinery charges of a single unit be ₹58.50 and the marked price is 30% more than the cost price, then what is the marked price of the calculator? (8 marks)
- (e) If the profit of the manufacturer is 20% and the marked price of a calculator is ₹192, then how much money has been spent on it as miscellaneous charges? (8 marks)
Study the pie diagrams given below carefully which represent the expenditure of two families I and II on different items in percentages and answer the questions asked below.
The annual income of families I and II are ₹4 lakhs and ₹5 lakhs respectively:
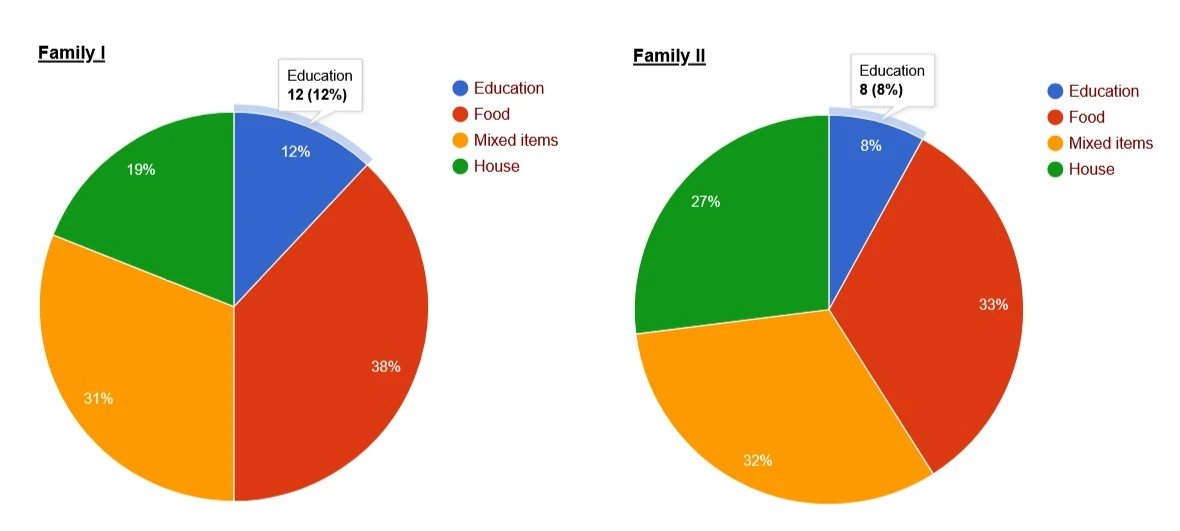
Questions:
- (a) How much less or more amount of money is spent on education by Family II as compared to Family I? (7 marks)
- (b) Which one of the two families I and II spends more amount of money on food and how much? (7 marks)
- (c) What is the proportion of money spent by families I and II on education? (7 marks)
- (d) What would be the angle at the centre of the pie diagram of money spent on housing by Family I? (7 marks)
- (e) How much money has been spent by families I and II together on mixed items? (8 marks)
OR Question:
The bar graph given below represents the additional tax collected by a State in different years. Study it carefully and answer the questions given below related to it:
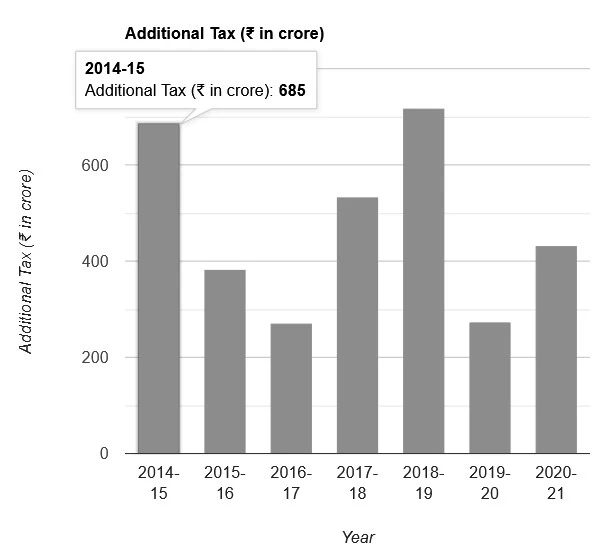
Questions:
- (a) How much percentage decrease in additional tax was registered in 2020-21 as compared to 2018-19? (7 marks)
- (b) How much percentage increase in additional tax was registered in 2017-18 as compared to 2016-17? (7 marks)
- (c) During which year the maximum percentage increase in additional tax was registered as compared to its preceding year? (8 marks)
- (d) From 2014-15 to 2020-21, what is the average of additional tax? (7 marks)
- (e) During which two consecutive years percentage of decrease in additional tax was minimum? (7 marks)